Fractals
In the past, I had written Python code for Ulam spirals and line diagrams. When I turned to fractals, the Mandelbrot set is mandatory to make for just about any thought about fractals. The vast majority of Mandelbrot set visualizations I found were made with contrasting colors, so, naturally, I wanted to make some with a pleasant color palette. For each image, each pixel is divided into subpixels to find how many of the coordinates are a part of the Mandelbrot set or diverge. Those who do diverge still look cool when shown based on how long they could hang on until mathematics forced them to diverge from the Mandelbrot set. There’s a GitHub repository for the code for these.
Image Gallery
Click or tap a thumbnail for the full resolution.

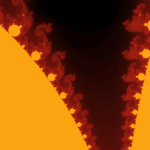
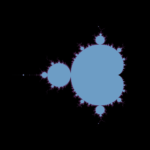
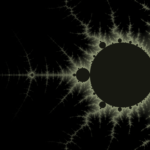
Mandelbrot center=-0.78-0.15i, top=0.2i, 1280×1024

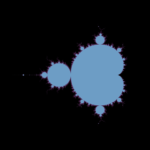
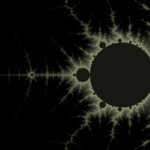
Mandelbrot center=-0.78+0.15i, top=0.2i, 1680×1050
Mandelbrot center=-0.78+0.15i, top=0.2i, 2560×1440
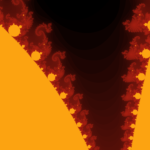
Mandelbrot center=-0.78+0.15i, top=0.2i, 3840×2160
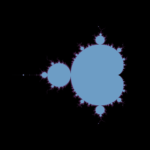
Mandelbrot center=-0.66+0i, top=1.6i, 1280×1024
Mandelbrot center=-0.66+0i, top=1.6i, 1680×1050
Mandelbrot center=-0.66+0i, top=1.6i, 2560×1440
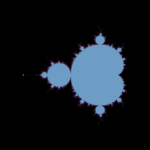
Mandelbrot center=-0.66+0i, top=1.6i, 3840×2160
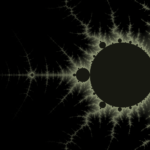
Mandelbrot center=-1.4+0i, top=0.03i, 1280×1024

Mandelbrot center=-1.4-0i, top=0.03i, 1680×1050
Mandelbrot center=-1.4+0i, top=0.03i, 2560×1440
Mandelbrot center=-1.4+0i, top=0.03i, 3840×2160